Every macOS application loads dynamic libraries (dylibs) and frameworks at runtime. Inspecting these loaded modules helps you debug linking issues, audit third-party dependencies, detect injected libraries, and understand an app’s internal architecture. This guide covers five methods to check what modules a process has loaded — from built-in command-line tools to a dedicated GUI app.
Quick Answer
Use vmmap <pid> | grep '\.dylib' in Terminal to list all dynamic libraries loaded by a running process. For static link dependencies, use otool -L /path/to/binary. For a visual, searchable interface that shows loaded modules with file paths, versions, and UUIDs in one click, use ProcXray.
What Are Loaded Modules on macOS?
A loaded module is a dynamic library (.dylib), framework (.framework), or bundle (.bundle) that the macOS dynamic linker (dyld) maps into a process’s address space at runtime. There are two categories:
- Load-time dependencies — libraries the binary links against at compile time. The dynamic linker loads them automatically when the process starts.
- Runtime-loaded libraries — libraries loaded on demand via
dlopen()during execution. Plugins, extensions, and optional features commonly use this pattern.
macOS system processes typically load 100–300 modules, while complex apps like Xcode or Chrome can load over 1,000. Knowing which modules are loaded is critical for diagnosing crashes, identifying version conflicts, and auditing security.
Method 1: vmmap — List All Loaded Modules of a Running Process
The vmmap command displays the virtual memory regions of a running process. Since each loaded dylib occupies its own memory region, you can filter the output to see every module currently in memory.
# List all loaded dylibs for a running process by PID
vmmap <pid> | grep '\.dylib'
To find the PID first:
# Find the PID of Safari
pgrep -x Safari
Example output:
__TEXT   7FF80B2A0000-7FF80B2C1000  r-x/r-x  /usr/lib/system/libsystem_kernel.dylib
__TEXT   7FF80B2C1000-7FF80B2FD000  r-x/r-x  /usr/lib/system/libsystem_c.dylib
__TEXT   7FF80B300000-7FF80B365000  r-x/r-x  /usr/lib/libobjc.A.dylib
Each line shows the memory address range, permissions, and the full path to the loaded library.
To include frameworks as well:
# Show all loaded dylibs and frameworks
vmmap <pid> | grep -E '\.(dylib|framework)/'
To count how many modules are loaded:
vmmap <pid> | grep '\.dylib' | awk '{print $NF}' | sort -u | wc -lWhen to use vmmap
Use vmmap when you need to see everything a running process has actually loaded into memory, including runtime-loaded modules that otool cannot show. It requires the process to be running and may require elevated privileges for system processes.
Method 2: otool -L — Check Static Link Dependencies
The otool command inspects Mach-O binaries. The -L flag lists all dynamic libraries the binary is linked against at compile time.
# List linked libraries for an application binary
otool -L /Applications/Safari.app/Contents/MacOS/Safari
Example output:
/Applications/Safari.app/Contents/MacOS/Safari:
    /System/Library/Frameworks/WebKit.framework/Versions/A/WebKit
    /System/Library/Frameworks/AppKit.framework/Versions/C/AppKit
    /usr/lib/libSystem.B.dylib
    /usr/lib/libc++.1.dylib
This shows the libraries the binary expects to load — its compile-time dependencies. It does not show libraries loaded at runtime via dlopen().
To inspect a specific dylib’s own dependencies:
otool -L /usr/lib/libobjc.A.dylibWhen to use otool
Use otool -L when you want to know what a binary should load before even running it. This is useful for verifying build configurations, checking that the correct SDK frameworks are linked, and detecting missing dependencies.
Method 3: lsof — Find Loaded Libraries via Open Files
The lsof command lists all files opened by a process. Since loaded libraries are memory-mapped files, they appear in lsof output.
# List all loaded .dylib files for a process
lsof -p <pid> | grep '\.dylib'
To include frameworks:
lsof -p <pid> | grep -E '\.(dylib|framework)'When to use lsof
Use lsof when you need a quick check and are already familiar with it. However, vmmap provides more detailed information (memory addresses, permissions) and is the preferred tool for module inspection.
Method 4: dyld_info — Inspect the Dynamic Linker
Starting from macOS 12 (Monterey), Apple provides the dyld_info command for inspecting dynamic linker information.
# Show all dependent dylibs of a binary
dyld_info -dependents /Applications/Safari.app/Contents/MacOS/Safari
For inspecting a running process’s dyld shared cache usage:
# List platform and dependencies
dyld_info -platform -dependents /usr/lib/libobjc.A.dylib
When to use dyld_info
Use dyld_info when you need detailed information about dynamic linker behavior, including platform requirements and dependency chains. It provides cleaner output than otool for dependency analysis.
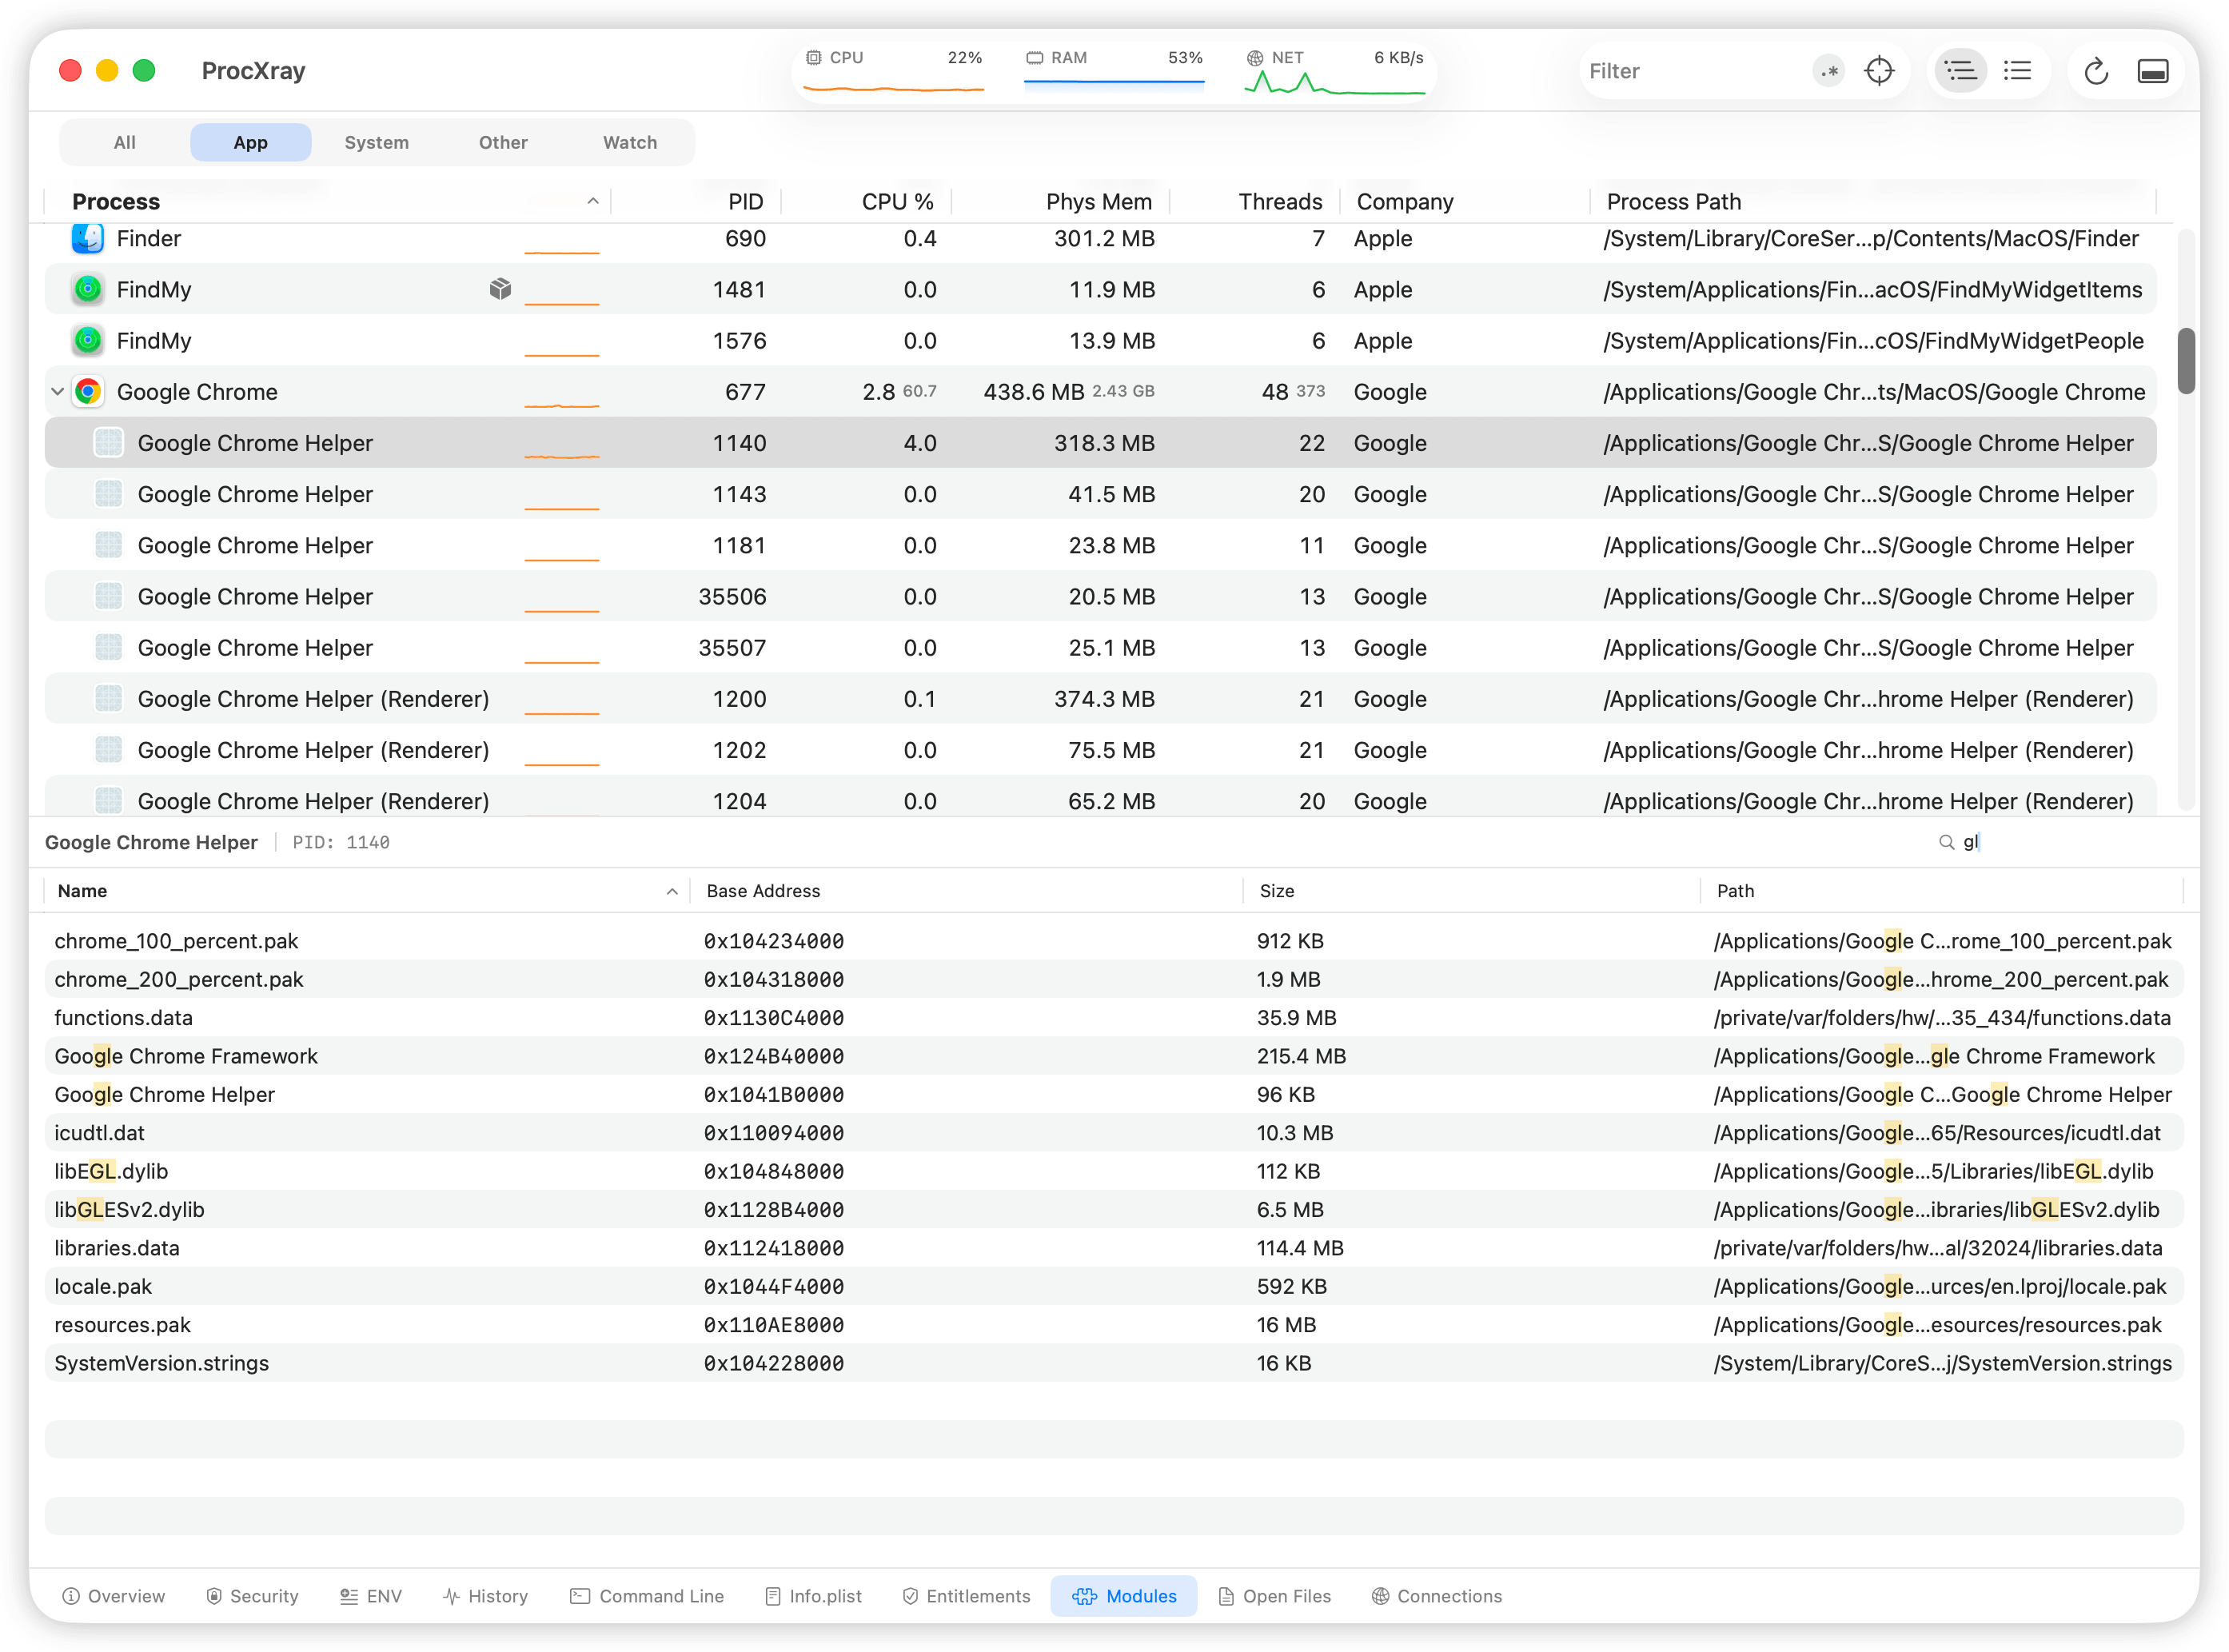
Method 5: ProcXray — Visual Module Inspector
ProcXray provides a dedicated Modules tab that displays every loaded module for any running process — no commands to remember, no output to parse.
How to inspect modules with ProcXray
- Launch ProcXray.
- Select a process from the process list (use the search bar or tree view to find it).
- Click the Modules tab in the detail panel.
- Browse the full list of loaded dylibs and frameworks, with file paths and details.
Use the search field in the Modules tab to filter by library name — for example, type “libsystem” to find all loaded system libraries, or “swift” to locate Swift runtime modules.
What ProcXray adds over CLI tools
- One-click inspection. Select a process, click Modules — done. No need to find the PID or type commands.
- Search and filter. Instantly filter modules by name with real-time results.
- Full context. See modules alongside the process’s environment variables, open files, network connections, and code signatures in adjacent tabs.
- Works for all processes. Inspect any running process without constructing different commands for different scenarios.
Comparison of Methods
| Feature | vmmap | otool -L | lsof | dyld_info | ProcXray |
|---|---|---|---|---|---|
| Shows runtime-loaded modules | Yes | No | Yes | No | Yes |
| Shows static dependencies | No | Yes | No | Yes | No |
| Requires process to be running | Yes | No | Yes | No | Yes |
| Memory address details | Yes | No | No | No | No |
| Search / filter | Manual (grep) | Manual (grep) | Manual (grep) | No | Built-in |
| Ease of use | Moderate | Easy | Moderate | Easy | Easiest |
| macOS version | All | All | All | 12+ | 14+ |
Practical Use Cases
Debugging a crash related to a missing or wrong library version
# Check if the expected library version is loaded
vmmap <pid> | grep 'libssl'
If the output points to a different libssl than expected (for example, a Homebrew version instead of the system one), you have found the version conflict.
Auditing an app for injected libraries
Security researchers and developers can check if unexpected libraries have been loaded into a process:
# Look for libraries not from /System or /usr/lib
vmmap <pid> | grep '\.dylib' | grep -v '/System/' | grep -v '/usr/lib/'
Any results may indicate third-party injections, plugins, or custom frameworks worth investigating.
Checking if an app uses a specific framework
# Does this app use SwiftUI?
vmmap <pid> | grep 'SwiftUI'

# Does it link against Metal?
otool -L /path/to/binary | grep 'Metal'
FAQ
What is the difference between a dylib and a framework on macOS?
A .dylib is a standalone dynamic library file. A .framework is a bundle directory that contains a dylib along with headers, resources, and metadata. Frameworks are the standard packaging format for Apple’s system libraries and third-party SDKs. At runtime, both are loaded the same way by dyld.
Can I see which dylibs a running app uses without Terminal?
Yes. ProcXray lets you select any running process and view its loaded modules in a graphical interface with built-in search. No terminal commands needed.
Why does a process load hundreds of libraries?
macOS relies heavily on dynamic linking. Even a simple “Hello World” app written in Swift loads 100+ modules because the Swift runtime, Foundation framework, and core system libraries each pull in their own dependencies. This is normal and by design — shared libraries reduce memory usage across the system.
Does otool -L show everything a process will load?
No. otool -L only shows compile-time link dependencies. Libraries loaded at runtime via dlopen() — such as plugins, optional features, and lazy-loaded components — are not shown. Use vmmap on the running process to see the complete picture.
Do I need sudo to inspect another process’s modules?
For your own processes, no. For system processes or processes owned by other users, you may need sudo with vmmap and lsof. ProcXray will prompt for the necessary macOS permissions on first launch.
Sources and References
- Apple: vmmap man page
- Apple: otool man page
- Apple: dyld — Dynamic Link Editor
- Apple: lsof man page
Download ProcXray → — free, macOS Sonoma+.