To see what is running on your Mac, start with Activity Monitor. If you need a process list for a script or a specific PID, use Terminal. Both are included with macOS.
Quick Answer
Press Cmd + Space, search for Activity Monitor, and choose View → All Processes. Sort the CPU or Memory tab to investigate resource use. In Terminal, ps aux lists processes, while top -o cpu shows a live view.
| What you want to check | Where to start |
|---|---|
| All processes, including background services | Activity Monitor → View → All Processes |
| Which app started a helper | View → All Processes, Hierarchically |
| The busiest processes right now | CPU tab → sort by % CPU |
| Memory use and overall pressure | Memory tab → sort by Memory and check the pressure graph |
| A process ID or command for a script | Terminal → ps aux |
Method 1: Activity Monitor
Activity Monitor is Apple’s built-in process viewer. It shows CPU, memory, energy, disk, and network usage for every running process.
How to open Activity Monitor
- Open Finder.
- Go to Applications > Utilities.
- Double-click Activity Monitor.
Alternatively, press Cmd + Space to open Spotlight, type “Activity Monitor”, and press Enter.
Viewing all processes
If Activity Monitor is showing only your own processes, switch its view:
- Click the View menu in the menu bar.
- Select All Processes.
You can now see every process running on your Mac, including system daemons and background services.
Sorting and filtering
- Click any column header (CPU, Memory, PID) to sort by that metric.
- Use the search field in the top-right to filter by process name.
- Switch between the CPU, Memory, Energy, Disk, and Network tabs for different resource views.
Activity Monitor can show parent-child relationships: choose View → All Processes, Hierarchically. This is useful for tracing which process started a helper. See Apple’s process-viewing guide.
Limitations
Activity Monitor works well for quick checks, but it has blind spots:
- No environment variables. You cannot inspect the environment a process was started with.
- Short-lived processes are missed. Processes that start and exit between refresh intervals are never displayed.
- No regex search. The search field only supports simple text matching.
Method 2: Terminal Commands
Terminal gives you more power and flexibility. Here are the most useful commands for checking running processes.
ps — List processes
The ps command prints a snapshot of current processes.
# List all running processes with detailed info
ps aux
The main columns help you identify the process before taking action:
| Column | Meaning |
|---|---|
| USER | Account that owns the process |
| PID | Process ID; it can change after an app restarts |
| %CPU / %MEM | CPU and memory usage reported by ps |
| RSS | Resident memory in kilobytes |
| COMMAND | Command and arguments; use ps -ww to avoid width truncation |
These are process measurements, not proof that a process is faulty. For system memory pressure, use Activity Monitor.
To find a specific process by name:
# Find all processes matching "Safari"
ps aux | grep Safari
To see the full command-line arguments (useful for scripts):
# Show full command for a specific PID
ps -ww -p 1234 -o pid,command
top — Real-time process monitor
The top command shows a live, continuously updating view of running processes.
# Launch top, sorted by CPU usage
top -o cpu
Press q to quit. Use top -o cpu to start sorted by CPU; see man top for the options supported by your macOS version.
For a short non-interactive CPU check, collect two samples and read the second one. The first sample has no previous interval for a valid per-process CPU comparison:
top -l 2 -s 1 -n 10 -o cpulsof — List open files and connections
Every process holds open files, sockets, and system resources. The lsof command reveals them.
# Show all open files for a specific process
lsof -p 1234

# Find which process is using a specific port
lsof -i :8080

# List all network connections
lsof -i
Limitations
Terminal commands are powerful but have trade-offs:
- Output can be overwhelming —
lsofoften produces thousands of lines. psshows a static snapshot; by the time you read it, short-lived processes may have already exited.- Correlating data across
ps,top, andlsofrequires manual work. - No visual process hierarchy without additional formatting.
Method 3: ProcXray
Use ProcXray when the process list raises a deeper question: which parent launched a helper, what arguments or environment it received, or how its resource use changed during your investigation.
What ProcXray adds
- Process tree view. Toggle between a flat list and a live hierarchical tree showing parent-child relationships. Instantly see which app or script spawned a process.
- Environment variables. Click any process to inspect every environment variable it was launched with — searchable and copyable as JSON.
- Short-lived process capture. Newly spawned processes are highlighted in green; recently exited processes are retained in red. Transient processes that Activity Monitor and
psmiss are captured. - Real-time regex search. Filter across process names, PIDs, command-line arguments, and paths using regex patterns.
- Code signature verification. See at a glance whether each process is signed, who signed it, and what entitlements it holds.
ProcXray is especially useful when you need to investigate why a process is running, not just that it is running.
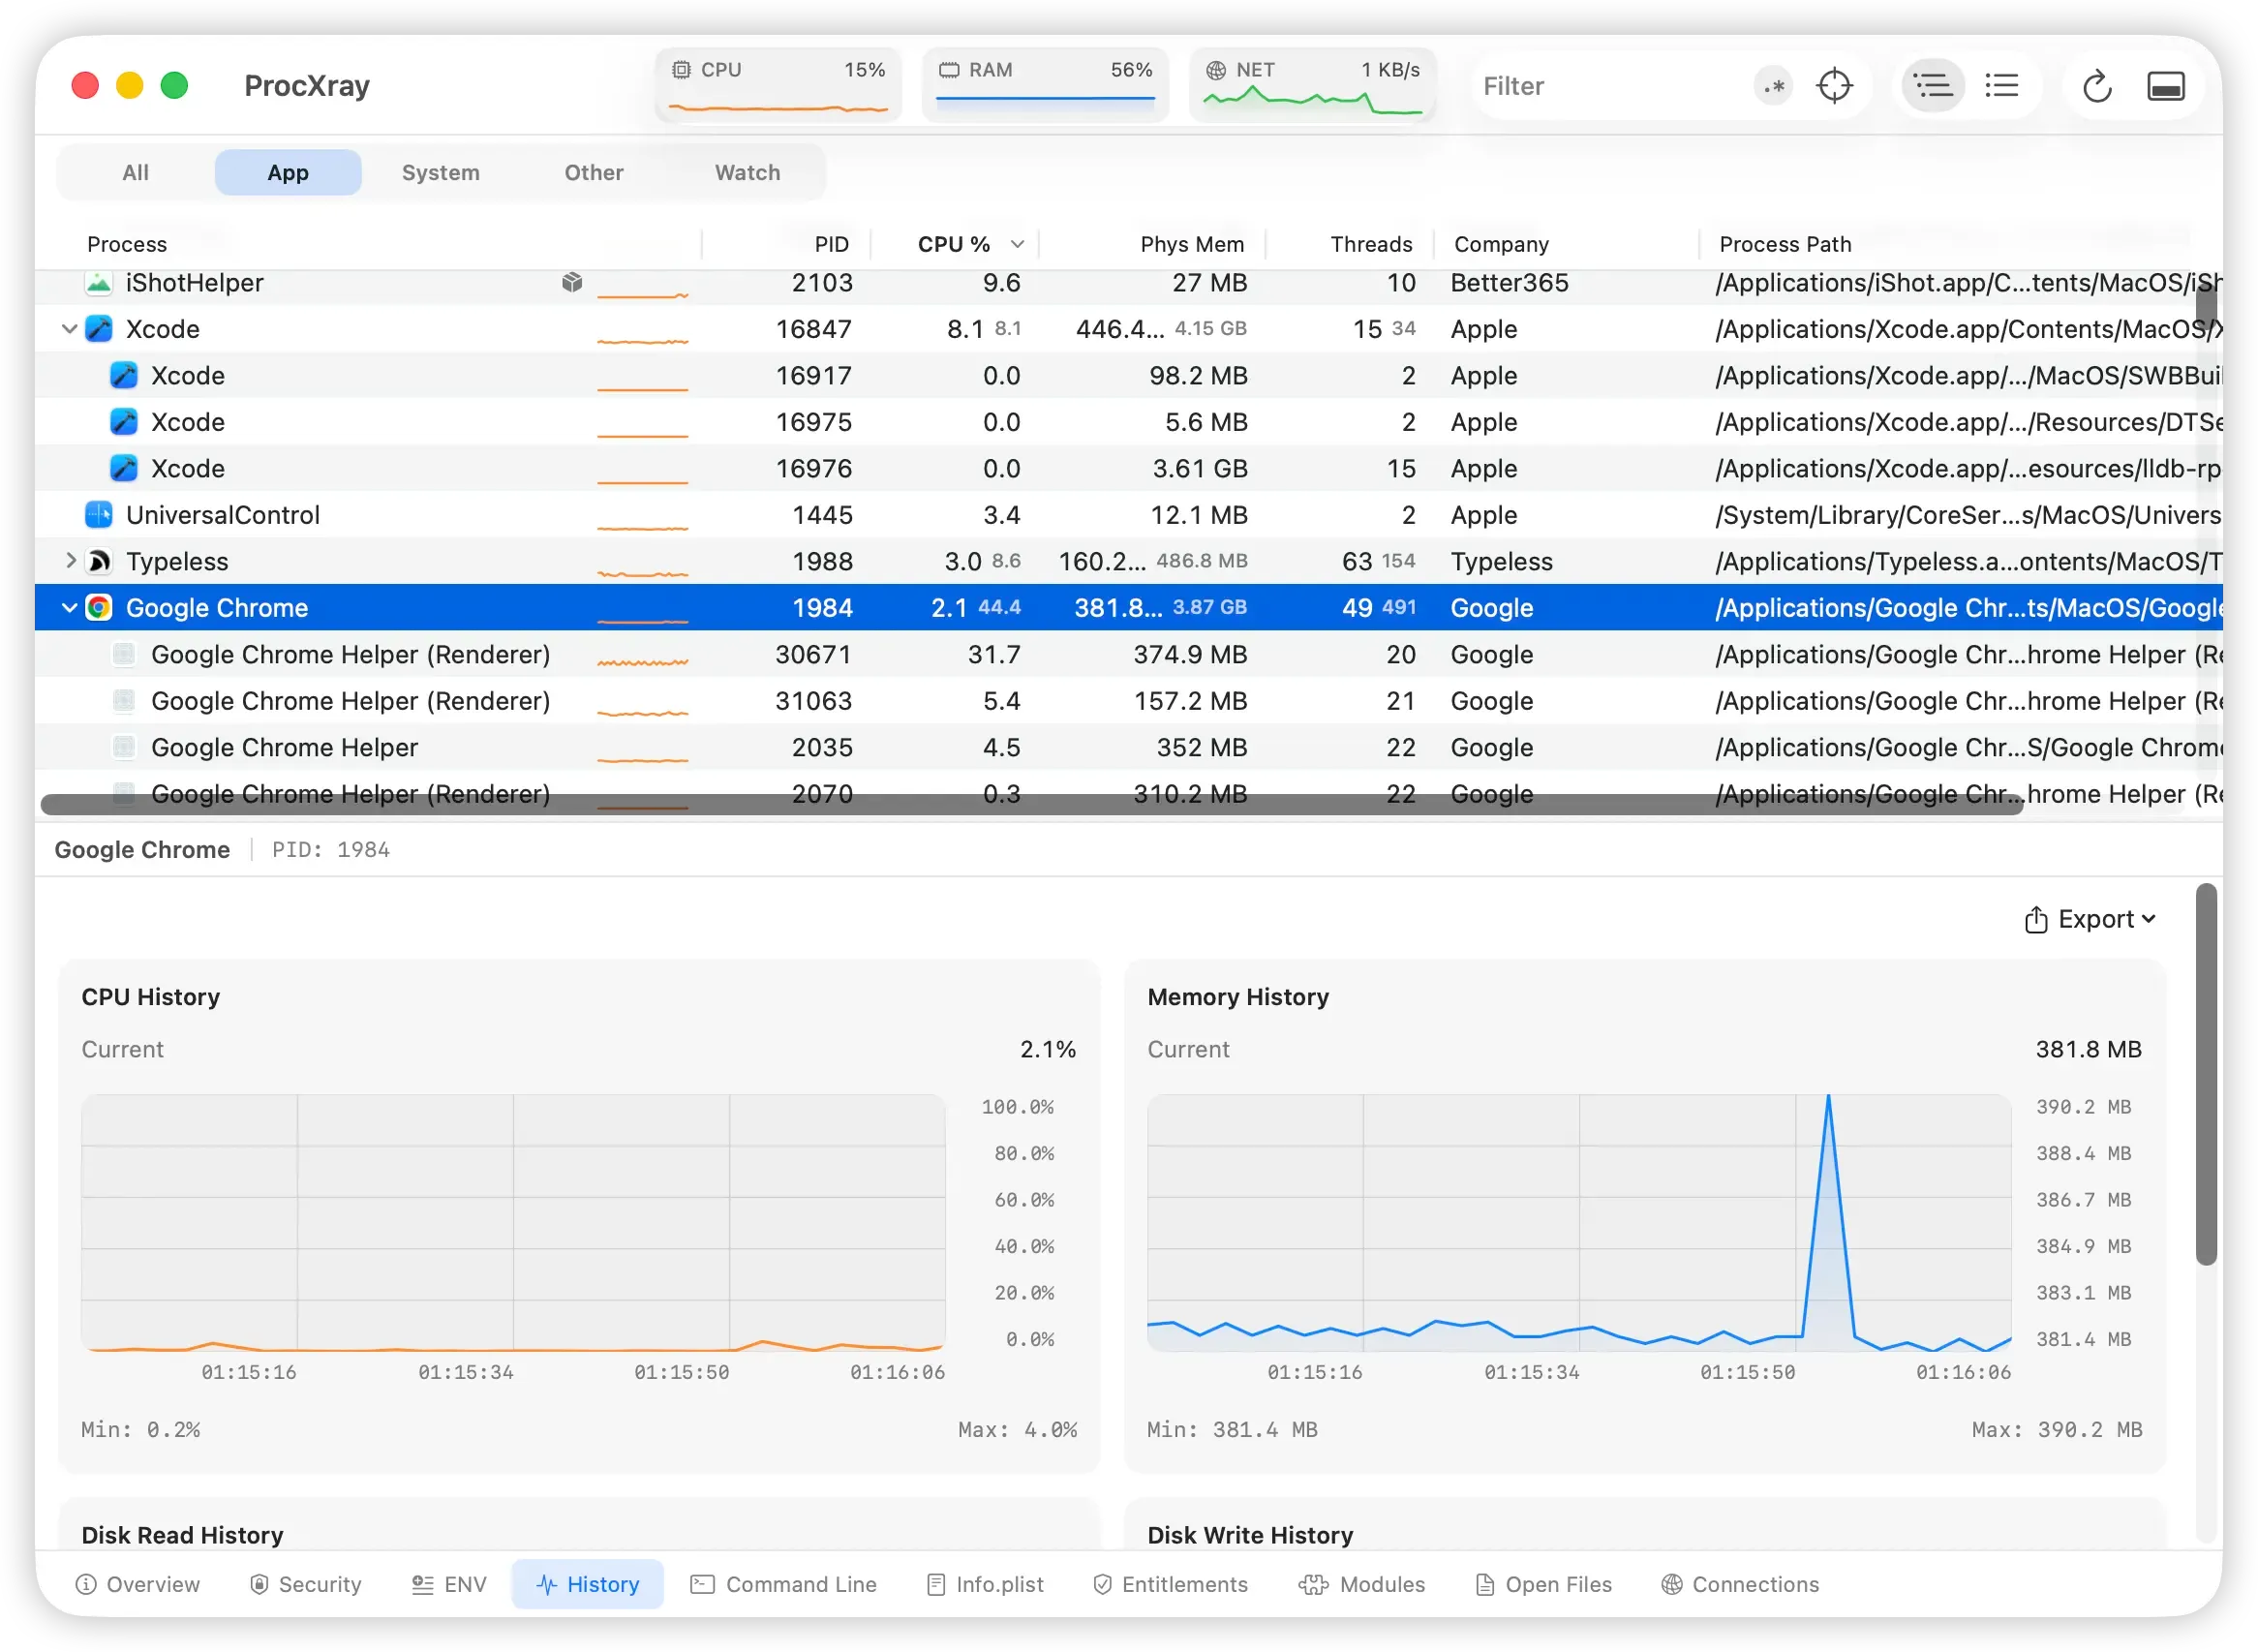
The selected process in this ProcXray screenshot is the main Google Chrome process (PID 1984); its renderer helpers appear as separate rows. The memory chart shows a brief spike followed by a return near the earlier level. It illustrates how to read a trend, not a confirmed memory leak.
When to Use Each Method
| Task | Activity Monitor | Terminal | ProcXray |
|---|---|---|---|
| Quick CPU/memory check | Best | Good | Good |
| See all running processes | Good | Best | Best |
| Find a process by name | Good | Good | Best |
| View process tree (parent-child) | Yes (View menu) | Limited | Best |
| Inspect environment variables | No | Awkward | Best |
| Catch short-lived processes | No | No | Best |
| Scripted/automated checks | No | Best | No |
| Check code signatures | No | Manual | Best |
FAQ
How many processes are normally running on a Mac?
The number varies with macOS, installed apps and current work. A count alone cannot tell you whether the Mac is healthy. Look for sustained resource use, memory pressure and symptoms rather than a fixed “normal” total.
Can I check running processes without installing anything?
Yes. Activity Monitor is pre-installed on every Mac, and Terminal commands like ps and top are available out of the box. These cover most basic needs. Third-party tools like ProcXray become valuable when you need deeper inspection capabilities.
How do I find and stop a process that is slowing down my Mac?
Save your work and quit the app normally first. If it remains unresponsive, select its process in Activity Monitor and use Stop → Quit, then Force Quit only if necessary. Unsaved work can be lost. Identify unfamiliar system processes before considering termination.
In Terminal, kill -TERM 1234 requests termination; replace 1234 with the PID you have just checked. kill -KILL 1234 is a last resort because it prevents cleanup. See Apple’s explanation of Quit and Force Quit.
Related guides
- Task Manager for Mac: The Real Equivalent (and What’s Better)
- Is This Mac Process a Virus? How to Tell If a macOS Process Is Safe
Sources and References
- Apple: Activity Monitor User Guide
pscommand referencetopcommand referencelsofcommand reference
Inspect process details and resource history with ProcXray →