You open Activity Monitor because your Mac feels heavy: apps beach-ball, tab switching is slow, and the Memory Pressure graph is yellow or red. The first instinct is often “something has a memory leak.” Sometimes that is true. More often, macOS is simply under real memory pressure because too many apps, browser tabs, virtual machines, or background workers are competing for RAM.
This guide explains the difference. Memory pressure is a system-wide condition. A memory leak is a process-level behavior. Once you separate those two ideas, you can stop guessing and decide whether to close apps, restart a browser, investigate one suspicious process, or move into developer profiling tools.
Quick Answer
Red Memory Pressure in Activity Monitor does not automatically mean your Mac has a memory leak. It means macOS is struggling to serve active memory requests efficiently and is likely relying on compression and swap.
Use this rule of thumb:
- Memory pressure is about the whole Mac. It can turn yellow or red when several normal apps use a lot of RAM at once.
- A memory leak is about one process. It keeps growing over time and does not return to a stable baseline after the work is done.
- Close apps first when Memory Pressure is red, especially browsers, Electron apps, virtual machines, design tools, and video tools.
- Investigate a leak when one process keeps climbing for minutes or hours, even while idle.
ProcXray helps with the second part: sort every process by memory, then use Resource History to see whether the shape is a one-time spike, normal high usage, or steady non-recovering growth.
What Memory Pressure Means on macOS
Activity Monitor’s Memory Pressure graph is the best high-level signal for whether your Mac has enough memory for its current workload. Apple describes it as a graph of how efficiently memory is serving your processing needs, based on free memory, swap rate, wired memory, and cached file memory.
The color matters more than “free memory”:
- Green means memory is healthy. macOS may still use most of your RAM, but it is doing so efficiently.
- Yellow means memory is under pressure. macOS is compressing memory and reclaiming cached data more aggressively. You may notice app switching or tab switching slow down.
- Red means severe pressure. macOS is likely swapping data between RAM and your startup disk. Apps may beach-ball, and the whole system can feel sticky.
This is why “my Mac is using 14 GB out of 16 GB” is not enough information. macOS intentionally uses free RAM for caches because empty memory is wasted memory. A Mac can use nearly all physical memory while still showing green pressure. The problem starts when the system cannot reclaim enough memory cheaply, so it compresses pages and swaps to disk.
Memory Pressure vs Memory Leak
The fastest way to avoid bad fixes is to compare the pattern, not just the number.
| Signal | Memory pressure | Memory leak |
|---|---|---|
| Scope | Whole system | One process |
| Typical pattern | Appears under load, often suddenly | Grows steadily over time |
| Main symptom | Yellow/red pressure, swap, beach balls | One app or helper keeps climbing |
| Drops after closing apps | Usually yes | Only when the leaking process exits |
| First action | Close heavy apps or tabs | Watch the process over time |
| Best tool | Activity Monitor for system view | ProcXray history, then profilers |
Bottom line: memory pressure is the symptom you feel; a memory leak is one possible cause. Treat red pressure as an immediate resource problem first, then look for a leak if one process shows persistent growth.
How to Tell Which One You Have
Follow this workflow before force-quitting random processes.
Step 1: Check the Memory Pressure graph
Open Activity Monitor → Memory and look at the graph at the bottom. If it is green, memory is probably not the reason your Mac feels slow. Check CPU, Disk, or Energy instead.
If it is yellow or red, continue.
Step 2: Sort by Memory
Click the Memory column and sort descending. Look for obvious large consumers:
- Browsers with many helper processes
- Figma, Photoshop, Lightroom, Final Cut Pro, DaVinci Resolve
- Xcode, simulators,
swift-frontend,xcodebuild - Docker Desktop, virtual machines, database servers
- Electron apps such as Slack, Discord, VS Code, Notion, or Teams
If several large apps are open, this is probably normal pressure rather than a leak.
Step 3: Check swap and compressed memory
In Activity Monitor’s Memory pane, check Compressed and Swap Used. Some compressed memory is normal. Some swap is also normal during heavy work. The warning sign is swap growing while performance is degrading and the same process keeps consuming more memory.
Step 4: Let the workload finish
If the pressure started during a known task, wait 5-10 minutes after the task ends:
- A browser tab finished loading a large web app.
- A video export completed.
- An Xcode build finished.
- A Docker container stopped.
- You closed the document or project that caused the spike.
Normal high usage often drops or stabilizes. A leak usually does not.
Step 5: Check the process trend
Activity Monitor shows a current snapshot. To see a trend, use ProcXray:
- Sort the process list by Memory.
- Select the suspect process.
- Open History.
- Watch the memory line while the app is idle.
A normal spike rises and then flattens or drops. A likely leak keeps stepping upward across repeated actions and never returns to the old baseline.
Step 6: Quit only the suspect process
When you have a suspect, quit that app or helper and watch memory pressure. If the graph returns from red/yellow to green, you found the pressure source. If the same process grows again after relaunch, you have a reproducible leak candidate.
For code-level diagnosis after that point, use the deeper workflow in How to Debug Memory Leaks on Mac Using ProcXray.
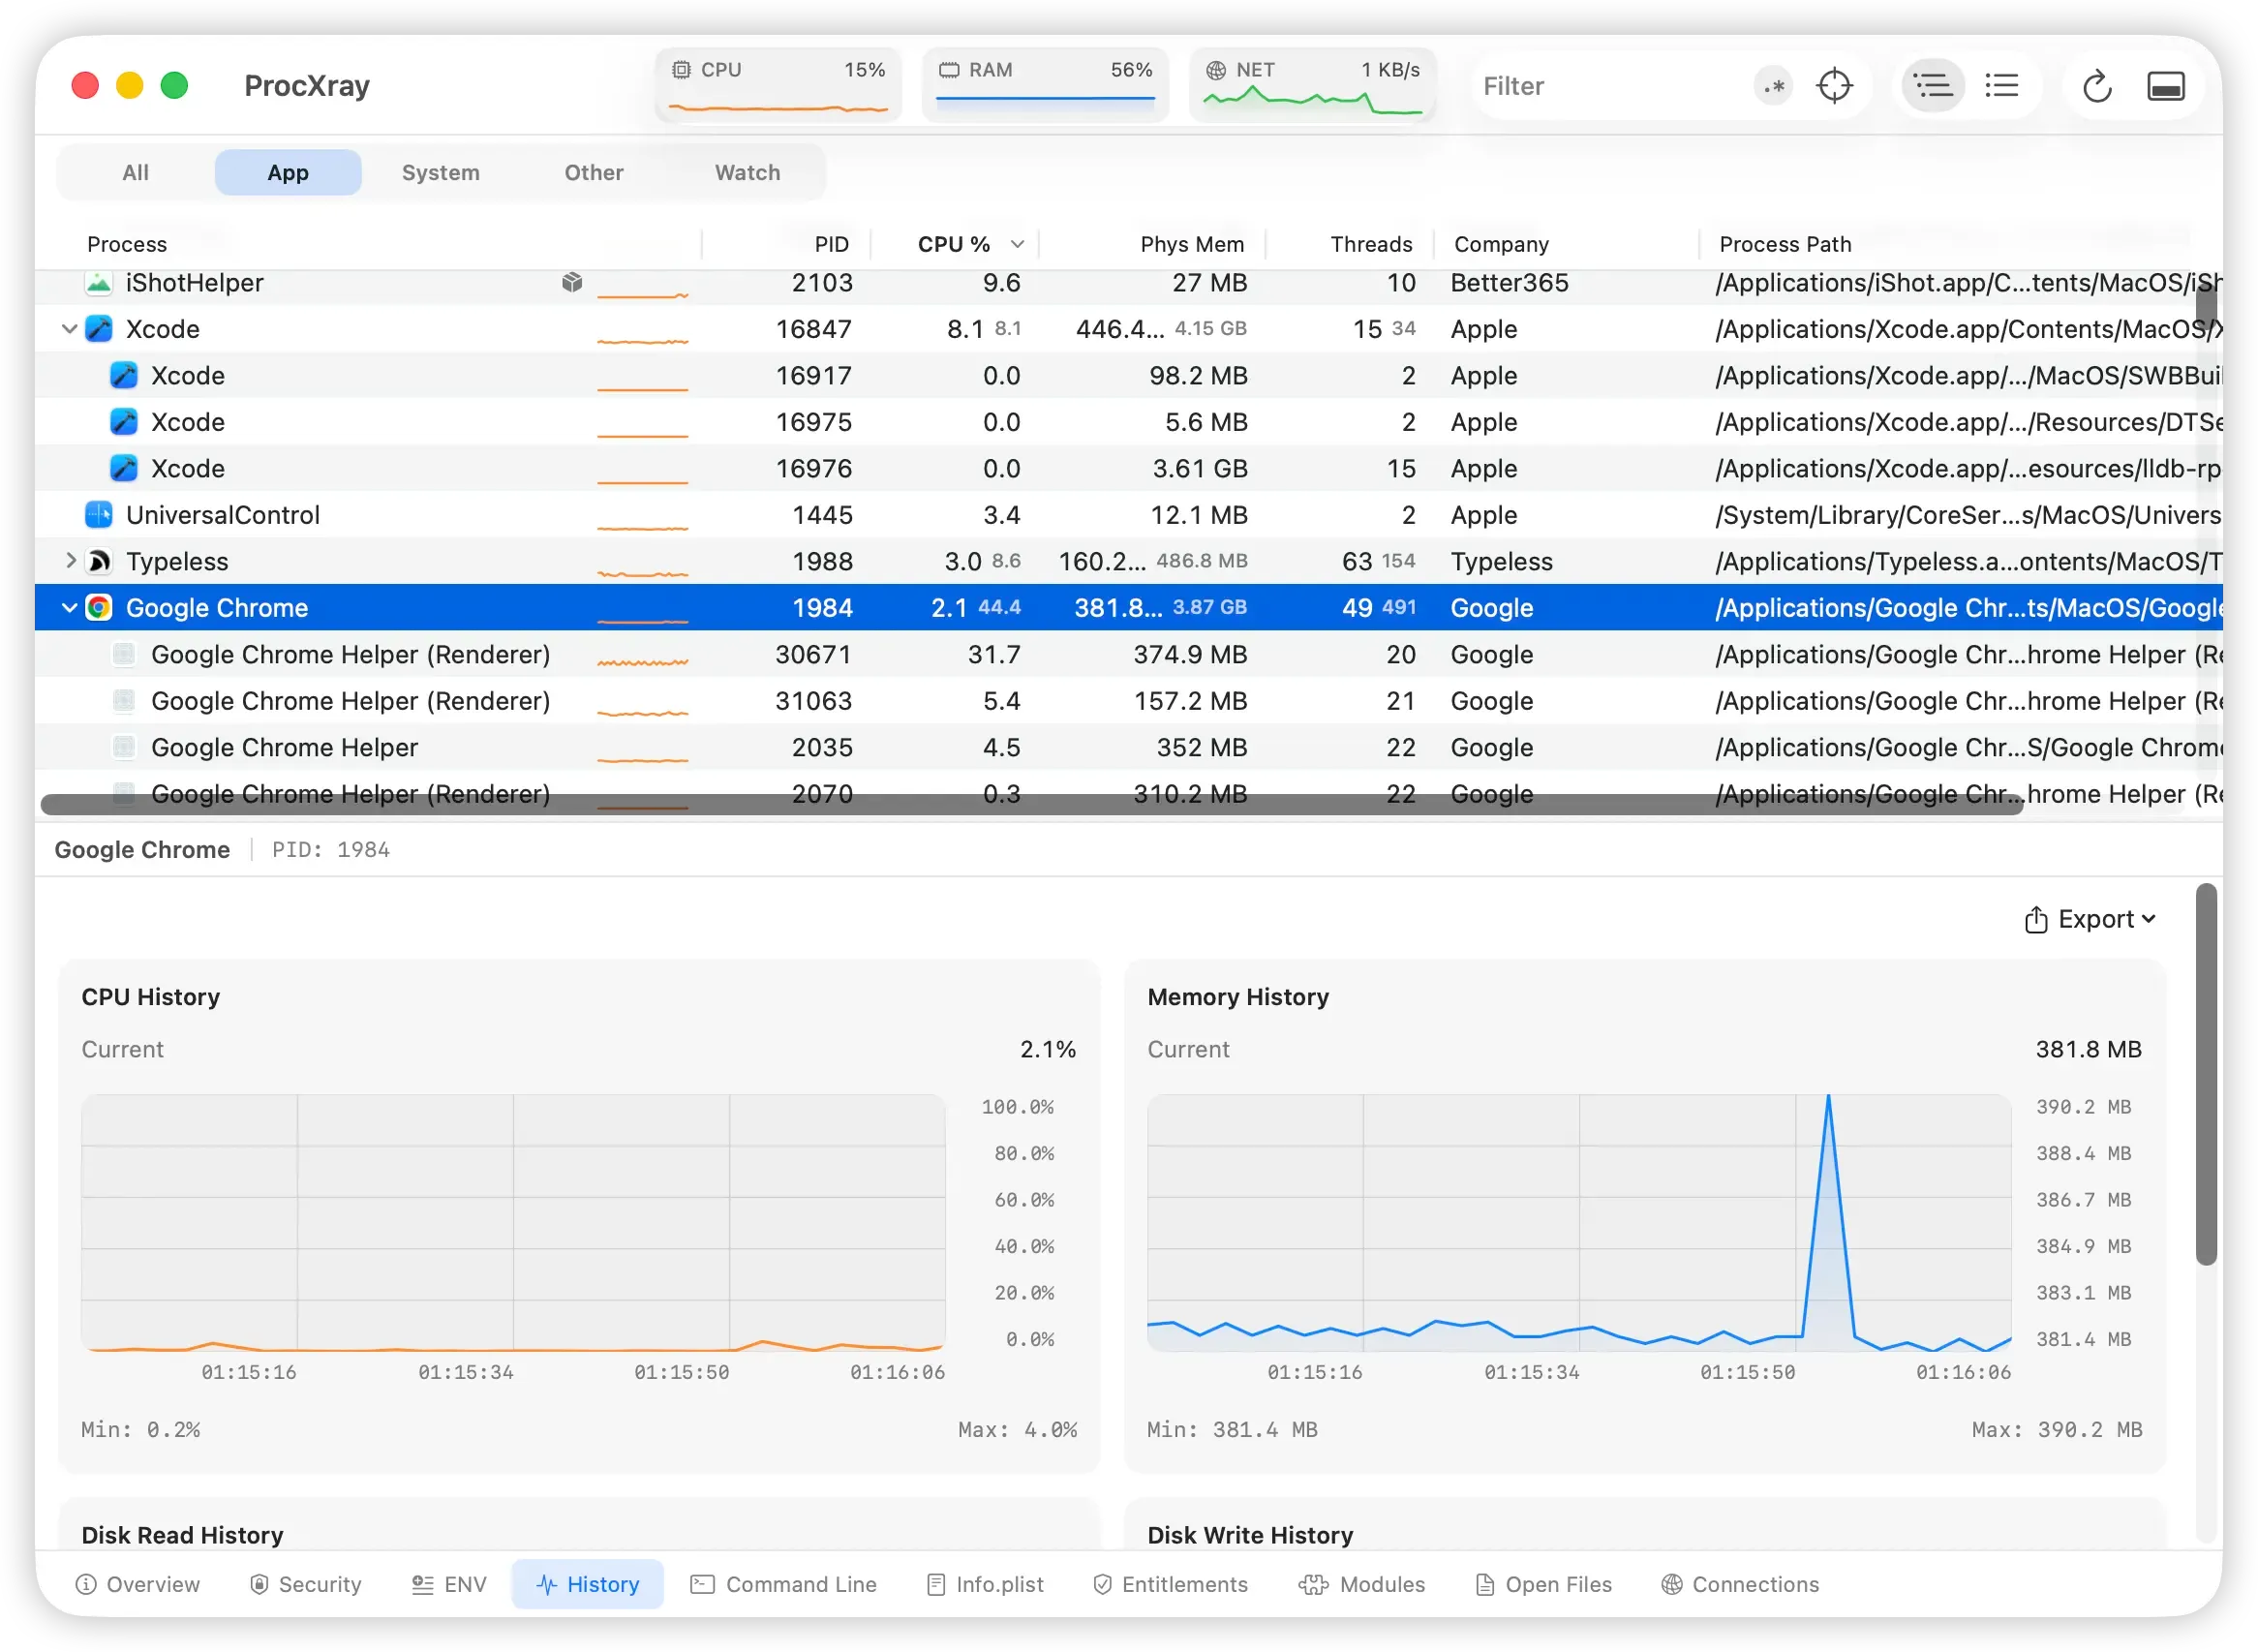
In this existing ProcXray screenshot, the selected Chrome process has a brief memory spike that returns near its previous level. A short spike alone does not establish a memory leak; compare repeated actions and a longer observation period. The process tree above shows Chrome’s helpers separately.
Common Causes of Memory Pressure
Most yellow or red pressure comes from normal workloads stacked together.
Browser tabs and web apps
Chrome, Safari, Edge, Arc, Brave, and Electron apps all split work into helper processes. One tab can hold hundreds of MB or several GB. Heavy web apps such as Gmail, Google Docs, Figma, Notion, Slack web, Discord web, ChatGPT, Claude, and Microsoft 365 can stay large for hours.
If browser helpers dominate the Memory tab, use the browser’s task manager first. For the full workflow, see Chrome Helper Eating Memory on Mac.
Creative and development tools
Photo editors, video editors, 3D tools, IDEs, and simulators legitimately use large memory pools. That does not make them leaky. The question is whether memory drops after you close the project, simulator, document, or export job.
Docker and virtual machines
Docker Desktop, local Kubernetes clusters, database containers, Parallels, VMware, and UTM can reserve or consume large memory blocks. This can push the whole Mac into yellow or red pressure even when no single app looks suspicious.
Cloud sync and photo libraries
iCloud Drive, Dropbox, OneDrive, Google Drive, Photos, and media analysis services can create bursts of CPU, disk, and memory. These are usually temporary, but they can overlap with foreground work and tip the system into pressure.
Long uptime
After days or weeks without restarting, browsers and Electron apps may accumulate helper processes, cached data, and extension state. That may be poor cleanup rather than a strict leak, but the fix is often the same: restart the app or the Mac.
Common Signs of a Real Memory Leak
A leak is more specific than “this app uses a lot of RAM.” Look for these patterns:
- One process grows steadily while the rest of the system is stable.
- Memory does not fall after the app becomes idle.
- The same action increases memory every time: opening a document, refreshing a page, running a query, or switching views.
- Swap keeps growing even after you close unrelated apps.
- Quitting the suspect process immediately relieves pressure.
Common examples include a browser helper that grows for six hours, an Electron app that increases while idle, a development server that grows after every request, or a native app that grows after repeated UI actions.
Step-by-Step Fixes
Apply these in order. The goal is to relieve pressure without destroying useful diagnostic evidence.
1. Close the obvious heavy workload
Close unused browser tabs, stop virtual machines, pause video exports, quit simulators, or close large design documents. Watch whether Memory Pressure returns to green.
2. Restart the suspect app
If one app is large but you cannot prove a leak, quit and reopen it. This is especially effective for browsers, Electron apps, IDEs, and chat clients. If memory returns to normal and stays normal, the issue was probably accumulated state.
3. Restart the browser, not just one tab
If browser helpers keep memory after tabs close, restart the browser. Extensions and service helpers can persist across tabs, so closing visible pages is not always enough.
4. Reduce login items
If pressure returns every time you log in, check System Settings → General → Login Items & Extensions. Disable apps you do not need at startup. This is not a memory leak fix by itself, but it lowers baseline pressure.
5. Restart the Mac
Restart when Memory Pressure stays yellow or red after you quit heavy apps, or when compressed memory and swap remain high after the workload is gone. A restart is not a diagnosis, but it gives you a clean baseline.
6. Treat repeatable growth as a leak
If one app grows after the same action every time, gather evidence:
- Note the process name and PID.
- Record the memory before the action.
- Repeat the action.
- Record whether memory returns to baseline.
- Check command-line arguments, parent process, open files, and loaded modules.
At that point, hand off to Xcode Instruments, browser DevTools, Node heap snapshots, Python tracemalloc, or the platform profiler for the app you are debugging.
How ProcXray Helps
Activity Monitor is enough to answer “is my Mac under memory pressure right now?” It is weaker at answering “which process caused this over time?”
ProcXray fills that gap:
- Per-process memory sorting shows every app, helper, build tool, and background daemon in one view.
- Resource History shows whether memory spiked once, flattened, dropped, or kept growing.
- Process Tree groups helpers under their parent apps, so identical-looking child processes make more sense.
- Command Line tells you which script, project, container, renderer, or extension process is actually running.
- Open Files and Connections help when memory growth is paired with file descriptor, socket, or resource leaks.
That makes ProcXray a triage layer: it tells you which process deserves deeper profiling and which ones are just large because they are doing real work. For the broader comparison, see ProcXray vs Activity Monitor.
FAQ
Is red Memory Pressure bad?
Yes, red Memory Pressure means your Mac is struggling to satisfy active memory demand efficiently. It is not proof of a leak, but it is a real performance problem. Close heavy apps or tabs first, then investigate whether one process keeps growing.
Is swap usage always bad on macOS?
No. Small amounts of swap can be normal during heavy workloads. Swap becomes a problem when it keeps growing, the Mac is visibly slow, and Memory Pressure stays yellow or red after the workload should be finished.
Is compressed memory a problem?
Compressed memory is a normal macOS optimization. It becomes a warning sign when compression is high, swap is growing, and app switching or typing feels delayed. Look at the Memory Pressure color, not just the compressed memory number.
How do I know whether Chrome is leaking memory?
Use Chrome’s built-in Task Manager to identify the largest tab or extension, then watch whether that helper’s memory keeps growing while idle. ProcXray helps by showing Chrome helpers alongside Safari, Edge, Arc, Slack, and other apps, with historical memory trends.
Should I restart my Mac to fix memory pressure?
Restarting clears memory pressure quickly, but it can hide the cause. If you are trying to diagnose the issue, first identify the largest processes and note whether one keeps growing. Restart after you have enough evidence or when the Mac is too slow to work.
When should developers use Instruments or language profilers?
Use developer profilers after you have a repeatable process-level pattern: the same app or service grows after the same action and does not return to baseline. ProcXray helps find the process and reproduction window; Instruments, DevTools, Node heap snapshots, or Python tracemalloc find the code path.
Related guides
- kernel_task High Memory on Mac: What Is Normal and How to Fix It
- How to Debug Memory Leaks on Mac Using ProcXray
Sources and References
- Apple Support: View memory usage in Activity Monitor on Mac
- Apple Developer: Memory Usage Performance Guidelines
- How to Debug Memory Leaks on Mac Using ProcXray
- Mac Running Slow? How to Find and Kill Resource-Hogging Processes
- Chrome Helper Eating Memory on Mac
- ProcXray vs Activity Monitor
Download ProcXray free → — sort every process by memory, see historical trends, and find whether your Mac has normal memory pressure or a real leak. macOS Sonoma+, Apple Silicon & Intel.