Chrome uses multiple processes to separate web content, browser controls, graphics, and services. Seeing several Google Chrome Helper entries on your Mac is expected. Process count alone does not tell you whether Chrome is wasting memory or doing something suspicious.
Start with the question you actually need to answer: what each process does, which page it serves, or why it is busy. This guide covers the first two. If your Mac is already struggling with memory pressure, use the Chrome Helper high-memory troubleshooting guide.
Which Chrome processes are you seeing?
The browser process manages the interface and coordinates other processes. Renderers handle web content, while graphics and service work have their own roles. Chrome’s architecture introduction explains this division.
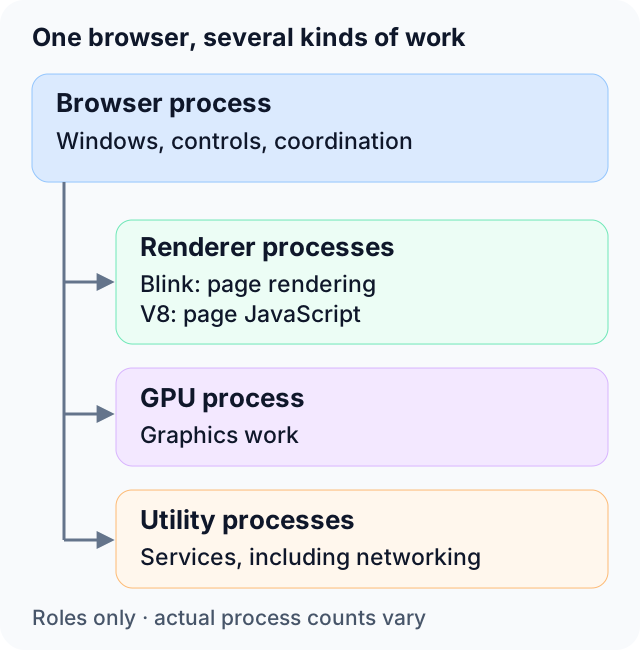
This is a role diagram, not a captured process tree or a fixed number of processes. Boxes represent kinds of work; a running browser can have multiple instances.
| Role | What it does | How to investigate it on Mac |
|---|---|---|
| Browser | Manages browser windows, controls, and coordination | Start with the main Google Chrome process; compare its PID with Chrome’s Browser task |
| Renderer | Handles page content, including layout and JavaScript | Look for Google Chrome Helper (Renderer), then match its PID to Chrome’s named tasks |
| GPU | Handles graphics work submitted to the GPU process | Identify Chrome’s GPU task and match its PID; do not infer GPU usage from a Helper name alone |
| Utility | Hosts services such as networking | Use Chrome’s task label and the process command line to identify the service |
Blink and V8 are components, not two extra process names to find in Activity Monitor. For web pages, Blink’s rendering work and V8’s JavaScript execution happen within renderer processes. A generic Helper name is less informative than the combination of task label, PID, and launch arguments.
Networking deserves a distinction: it is not simply another renderer. Chromium’s Network Service documentation describes a service that the browser can host in a dedicated utility process. Its placement is configurable, so do not treat one diagram as a promise about every Chromium build.
Why Chrome separates the work
The split provides failure containment and security boundaries. A renderer crash can leave the browser running, although content sharing that renderer can be affected. A sandbox also limits what web-content code can access on the computer. These are central goals of Chromium’s multi-process design.
Isolation has costs: separate processes require resources and communication. That does not make the smallest process count the best configuration. Diagnose the workload causing a problem before trying to reduce the number of Helper entries.
Why tabs, tasks, and PIDs do not match one-to-one
A tab is a visible container. A task is an item Chrome exposes for inspection. A PID identifies an operating-system process. Counting one does not reliably count the others:
- A page can embed content from another site in an iframe, with that content in a separate renderer.
- Multiple documents or tasks can share a process.
- Browser, graphics, and utility work add processes beyond those serving pages.
Site Isolation helps separate sites at process boundaries. It does not mean exactly one process for each website or exactly one for each tab. Allocation depends on the content, platform, and available resources. Chromium’s process model documentation also explains how Task Manager groups tasks sharing a process.
This makes PID matching more useful than matching row counts. Closing a tab is not a reliable test that exactly one Helper should disappear.
Match a Chrome task to a Mac process
Use this observation workflow while the page you want to inspect is open. It does not require stopping any processes.
1. Find the task inside Chrome
Open More (⋮) → More tools → Task Manager. Locate the task for a recognizable page. Chrome documents this menu in its performance help.
If Process ID is hidden, right-click the column header and enable it. Record the task name and PID together; Chromium’s Mac debugging instructions describe this column. A group of tasks may share the same PID.
2. Find that PID in Activity Monitor
Open Activity Monitor, choose View → All Processes, and use View → Columns to show Process ID if needed. Find the PID you recorded. You can sort by that column; searching for Chrome first can narrow the list.
To explore relationships, switch to View → All Processes, Hierarchically. Apple documents these views in its process inspection guide. A Helper’s parent is useful context, but its page identity still comes from Chrome.
3. Compare one change
Open another page, note its task and PID, and compare. Save any work before closing the page normally. Observe which tasks disappear and whether the PID remains associated with other tasks. Do not expect a predetermined process count.
For a repeatable record, write down:
- macOS and Chrome versions, and the time of observation;
- the action you performed;
- the task labels and PIDs before and after;
- whether you saw a slowdown or another actual symptom.
If a process exits or restarts, capture its identity again. A PID recorded earlier is not a permanent label for a page.
Inspect Helper roles and history in ProcXray
Once Chrome has supplied the task’s PID, locate that process in ProcXray. Expand the Chrome group in tree view, select the matching row, and inspect Command Line and History.
Launch arguments can help distinguish roles. For example, --type=renderer identifies renderer work, while --type=utility identifies a utility process. Chromium defines these process-type values in its command-line switch source. Read existing arguments; you do not need to change Chrome’s launch settings.
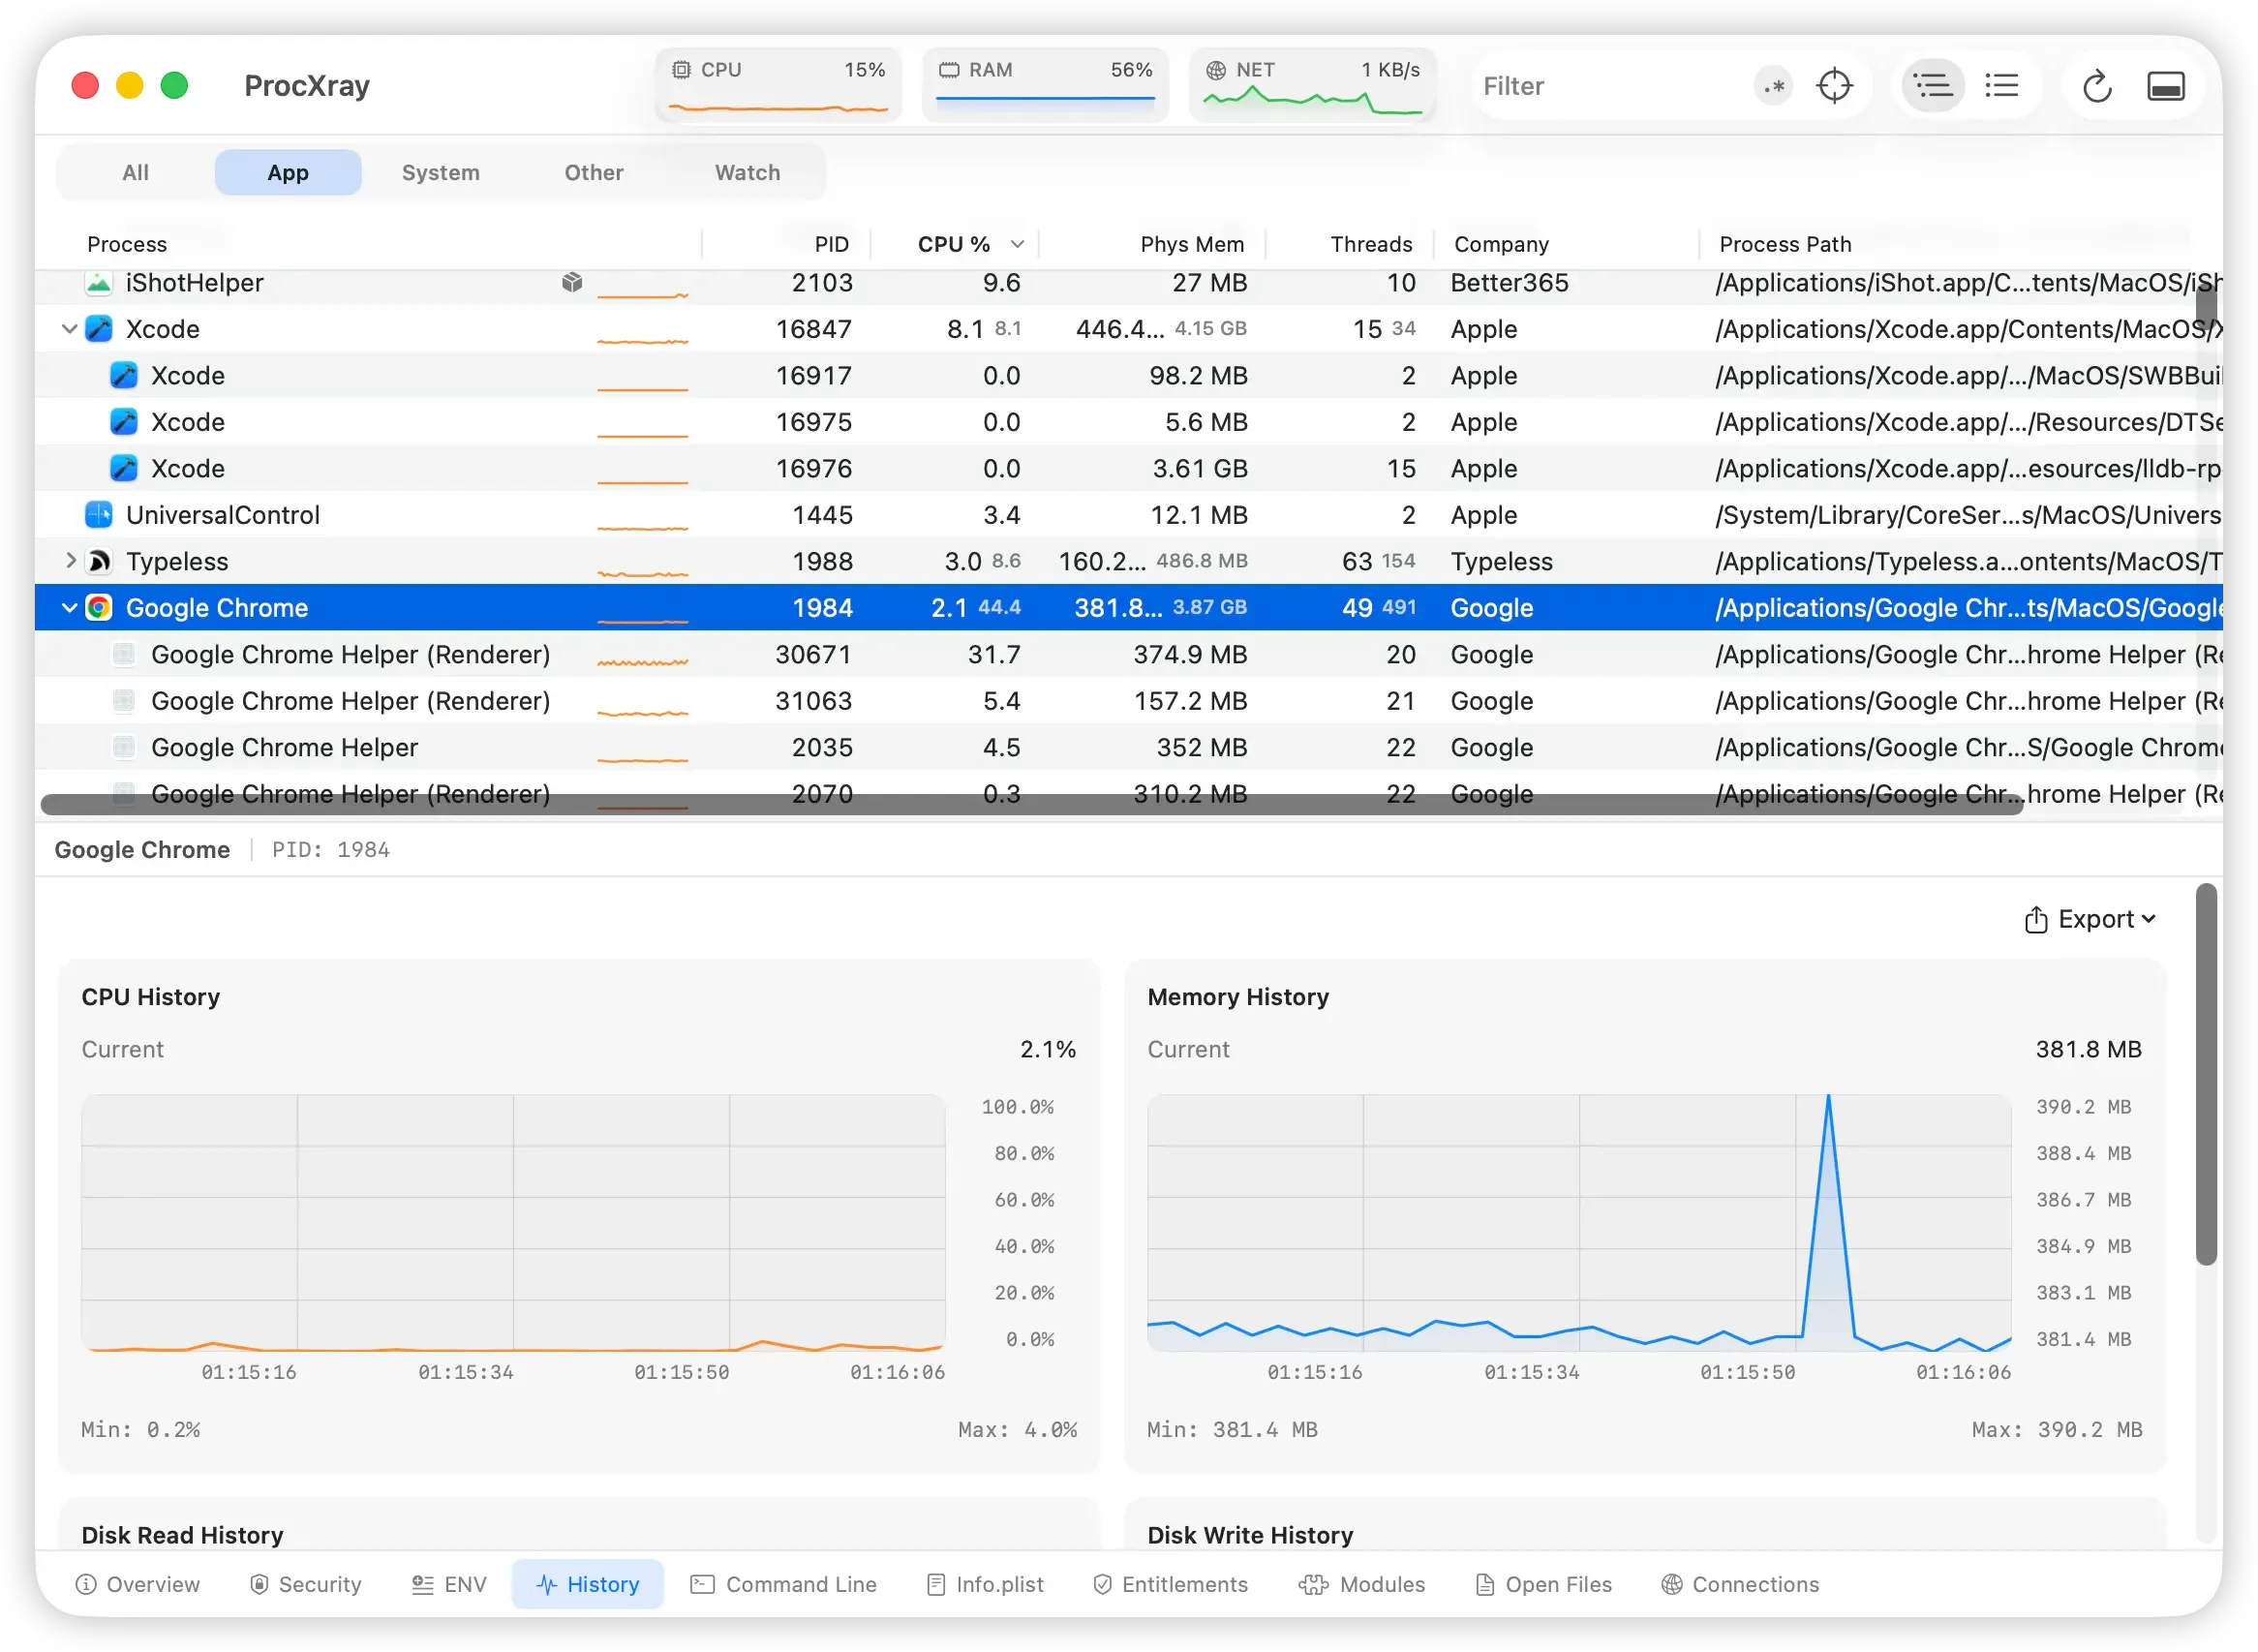
In this existing screenshot, the selected process is Google Chrome, PID 1984. Renderer helpers appear beneath it with their own PIDs. The history belongs to the selected main process; this is not a measurement of a particular tab or a new before-and-after experiment.
Use Chrome for task names and ProcXray for process context and resource history. Launch arguments do not reliably reveal a renderer’s tab title, URL, or extension identity. For more about interpreting relationships, see finding a parent process on Mac.
When should you investigate further?
Investigate symptoms and repeatable behavior rather than a target number of processes.
| What you observe | Useful next check |
|---|---|
| Many Helpers, but the Mac remains responsive | Identify their roles if needed; count alone is not a reason to terminate them |
| High memory alongside sustained yellow or red memory pressure | Find the named Chrome task and follow the memory troubleshooting steps |
| CPU stays busy after your intended work finishes | Match the busy PID back to Chrome, then compare with the page closed or the relevant extension disabled |
| A Helper has an unexpected path or identity | Check its executable and signature using the process safety guide |
Apple’s Memory Pressure graph describes how efficiently memory is meeting the system’s needs. Read it alongside responsiveness; a large individual process does not establish a leak. The memory pressure versus memory leak guide explains what to investigate next.
FAQ
How many Chrome Helper processes are normal?
There is no universal healthy count. Compare the tasks you are running and the symptoms you observe. A screenshot from a different Mac or workload is not a baseline for yours.
Is every Google Chrome Helper a tab?
No. Helper processes perform different roles, and a renderer is not a one-to-one tab label. Match the PID with Chrome’s task list before assigning it to a page.
Can I quit all the Helpers to save memory?
Save your work and close unwanted tabs normally. If you want to end the browsing session, quit Chrome itself. Using Task Manager’s End Process can lose unsaved work, and shared tasks can be affected; avoid terminating an unidentified Helper just to lower the count.
Can ProcXray tell me which tab a renderer belongs to?
Use Chrome Task Manager for that mapping. ProcXray complements it with process relationships, launch arguments, and resource history. A browser window’s owner is not sufficient to identify each renderer serving its tabs.
Inspect Chrome’s process tree and resource history with ProcXray →